Definition of 'Relative Strength Index - RSI'
A technical momentum indicator that compares the magnitude
of recent gains to recent losses in an attempt to determine overbought
and oversold conditions of an asset. It is calculated using the
following formula:
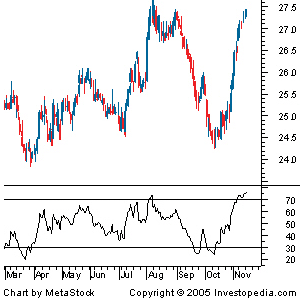
RSI = 100 - 100/(1 + RS*) *Where RS = Average of x days' up closes / Average of x days' down closes.  As you can see from the chart, the RSI ranges from 0 to 100. An asset is deemed to be overbought once the RSI approaches the 70 level, meaning that it may be getting overvalued and is a good candidate for a pullback. Likewise, if the RSI approaches 30, it is an indication that the asset may be getting oversold and therefore likely to become undervalued. |
|
Investopedia explains 'Relative Strength Index - RSI'
A trader using RSI should be aware that large surges and drops in the
price of an asset will affect the RSI by creating false buy or sell
signals. The RSI is best used as a valuable complement to other
stock-picking tools.
Let's go two steps further with the RSI indicator by reading An Introduction To The Relative Strength Index and Relative Strength Index And Its Failure-Swing Points. Source: Investopedia |
Philippines News: FREE
Monday, March 17, 2014
Relative Strength Index - RSI
Subscribe to:
Post Comments (Atom)
Labels
#SMPH
#SMPH #ALI #FLI #MEG
8990 Holdings
aboitiz group
Aboitiz Power
AC
AGI
ALI
Alliance global group inc
AP
AYALA
Ayala Corp
Ayala Land Inc
Banks
Belle Corp
Bloomberg
BPI
BSP
CEB
Cebu Pacific
Century Pacific Food Inc
Century Properties Group
CNPF
Col Financial
COL Model Portfolio
COLing the shots
COSCO
CPG
Credit Suisse
D&L
DD
DMCI
DNL
Double Dragon
EDC
EMP
ETF
FED
Filinvest Land Inc
First Philippine Holdings Corp
FLI
FMETF
FMIC
FPH
geri
GLO
Globe
GT Capital Holdings
GTCAP
House
ICT
ICTSI
IMI
IPO
JFC
JGS
Jollibee
LRW
LRWC
LTG
MARC
MBT
MEG
Megaworld Corporation
MER
Meralco
Metobank
Metro Pacific Investment Corp
mpi
MPIC
MWC
Pancake House
PCKH
PGOLD
Philippine Long Distance Telephone Co
Philippine Seven Corporation
Philippine Stock Exchange
Phoenix Petroleum
PLDT
PNB
PNX
PSB
PSE
PSEi
PSPC
purefoods
Puregold Price Club Inc
RFM
San Miguel Corporation
SEVN
SM
SMB
SMC
smph
Stock Market
Stocks
TEL
Universal Robina Corporation
URC

No comments:
Post a Comment